


The best backlinks are earned, not built
What if you could consistently create content that passively attracts high-authority links every single day?
⛔️ No cold email outreach.
⛔️ No link payments.
⛔️ No begging website owners for placements.
Just natural, high-quality links that boost domain authority and drive rankings for your entire site.
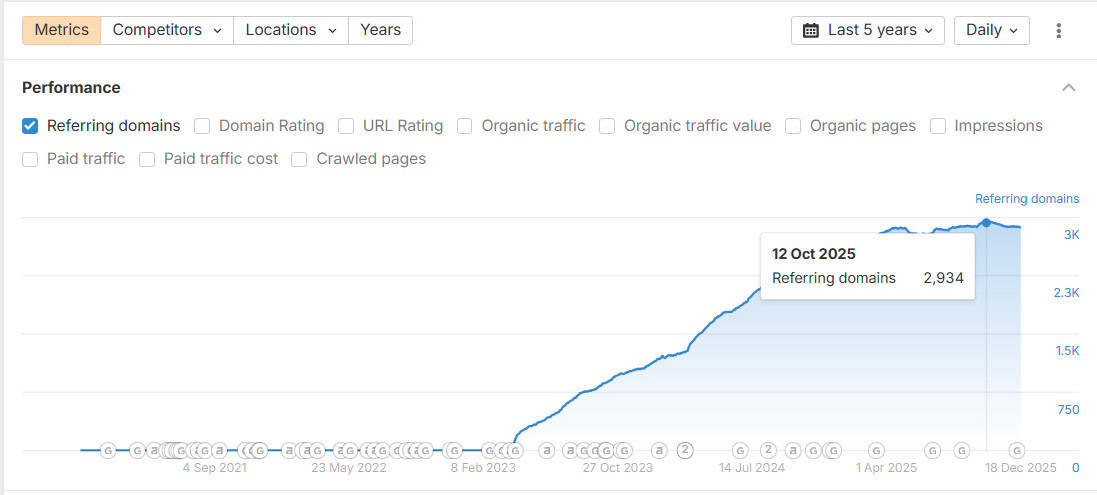
Over the last two years…
I’ve created 45 linkable assets that have generated 2,900+ high-DR links from sites like this:
The best part?
AI has made the linkable assets process 10x faster and easier than ever. What used to take days of research now takes minutes to do.
But here’s the thing that most people miss:
Your linkable assets might be unique, valuable and well-researched.
But if they sit buried on page #2 of Google and never get referenced in AI answers, they will never earn a single link.
To make this strategy work you need three things:
- A quality link-worthy asset
- First page visibility in Google
- Citations in AI answers
So, in this guide, I will show you my exact process for creating linkable assets that earn links passively while ranking on page #1 AND getting cited in AI answers.

What Will I Learn?
What Are Linkable Assets?
Linkable assets are unique, shareable pieces of content like:
- Original research
- Statistics hubs
- Tools
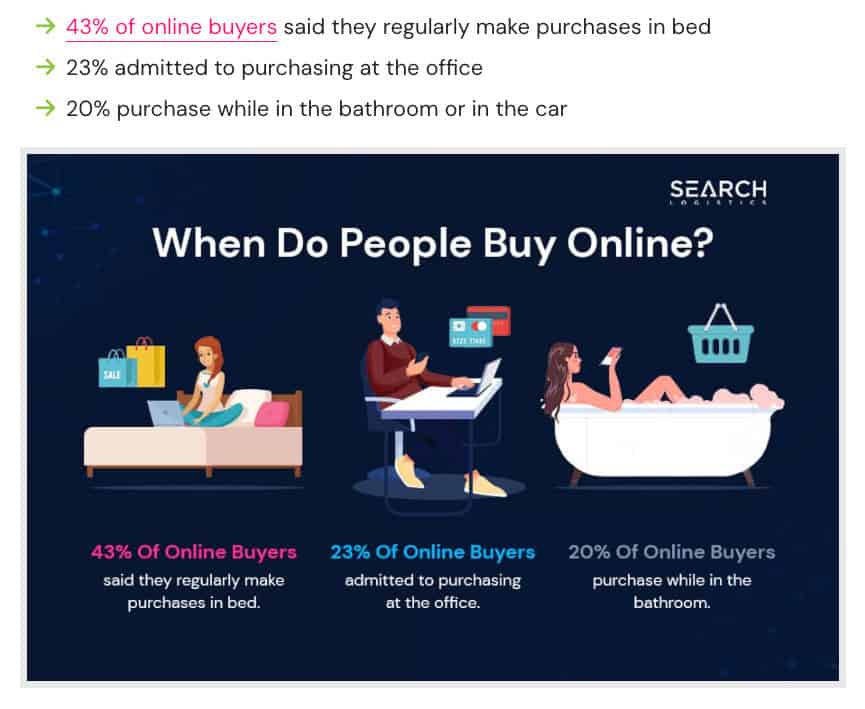
…and infographics that naturally attract backlinks from other websites.
They work by providing data that journalists, bloggers and writers need to reference. When they reference information, they link to you as the source.
Think about it like this…
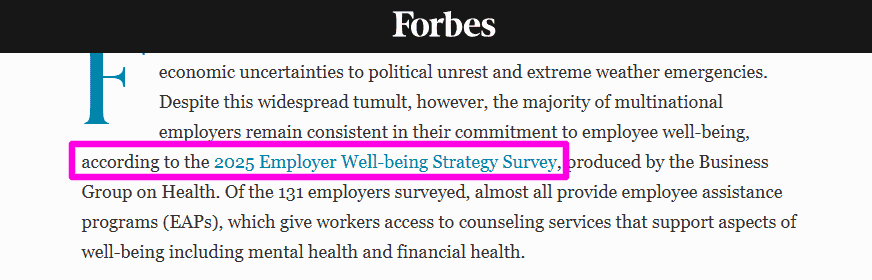
Every time a writer types “according to…” they need a source to link to. When a journalist references a statistic in an article, they need proof to back it up.
That’s why linkable assets are so effective.
You are positioned as the authoritative source that journalists and writers can reference as proof in their articles.
It’s really just a case of supply and demand.
But to make this strategy work, you need to do more than create a linkable asset and hope that others will find it.
You also need to position your content to be discovered at the right time and place.
More on that later!

3 Types Of Linkable Assets That Earn Backlinks
Not every piece of content earns links naturally.
After creating 35 linkable assets over the last two years, I’ve found that there are three types that consistently do better than others:
- Statistics Hubs – Most consistent and easiest to create
- Original Research – Earns the highest authority backlinks
- Tools & Calculators – Regularly cited as recommended resources
Each type of linkable asset earns different types of backlinks.
Ideally, you want to have all three on your site to create a more diverse backlink profile and increase your rankings across your entire site.
Let’s look at how each type of linkable asset works for your site…
Asset #1: The Statistics Hub
This is my favourite linkable asset type.
It’s also where I’ve had the most consistent success in attracting authority backlinks passively.
Some from large publications I would never have had a chance with before.
Here’s how it works:
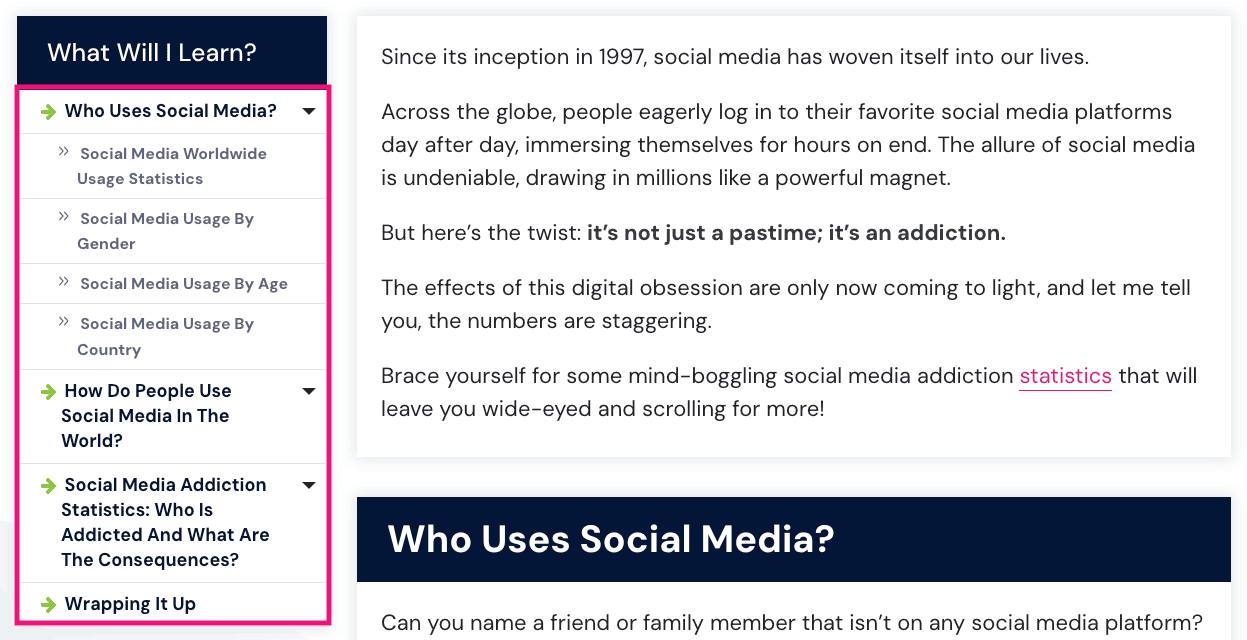
The key to making statistics hubs work as linkable assets is ranking for the keyword “topic + statistics”.
Doing that makes you the go-to source for any data on that specific topic.
Typically, great statistics hub content has between 50 and 100 stats in the content, logically grouped by theme.
This makes it easy for people to find relevant statistics, and it makes it easier for Google and AI search engines to understand your content.
Both are essential for earning tons of great links.
Look at some domains we’ve received links from with statistics hubs:
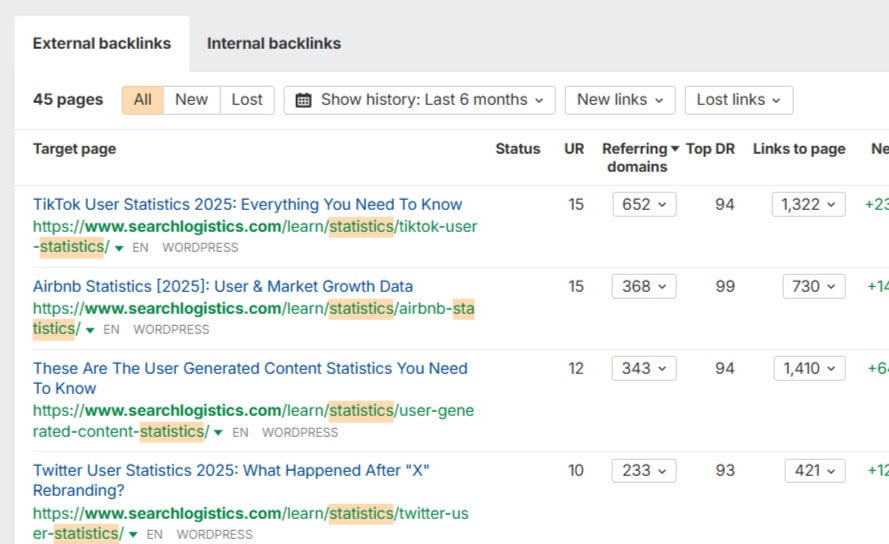
And that’s just one piece of content.
Now imagine how that scales with 35 of them!
With that in mind, let me show you my exact process for creating statistics hub content that earns high-value links consistently (and ranks).
✅ Step #1: Identify Your Target Keywords
This is one of the most important steps:
You need to do keyword research to find the statistical topics to target. Getting this wrong now can leave you with a lot of work and not many results.
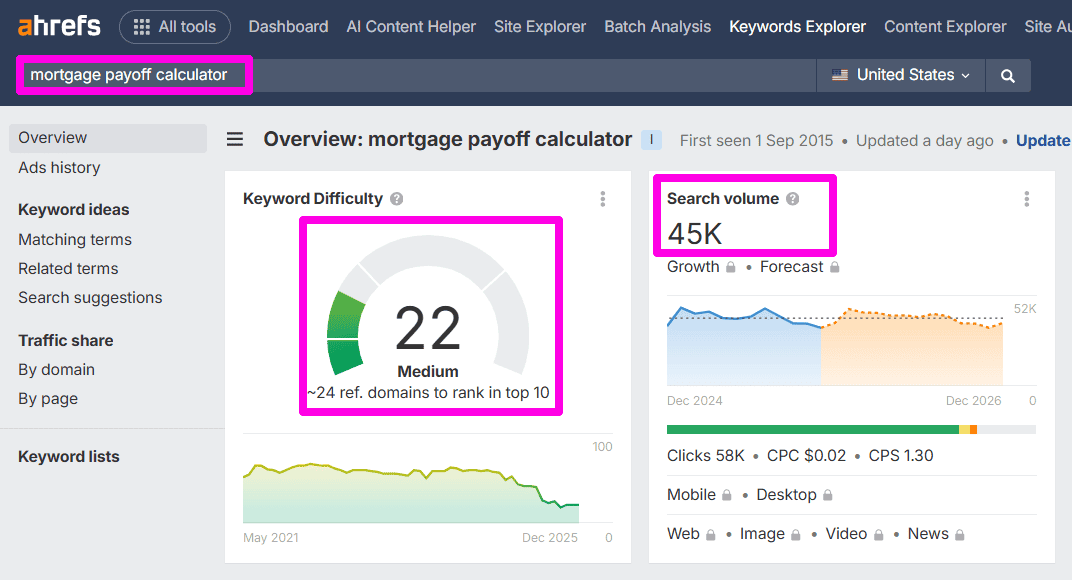
Use Ahrefs or Semrush to find statistics keywords that you can realistically rank for on page #1.
You’re looking for patterns like-
- topic + statistics
- topic + stats
- topic + date
- state of “topic”
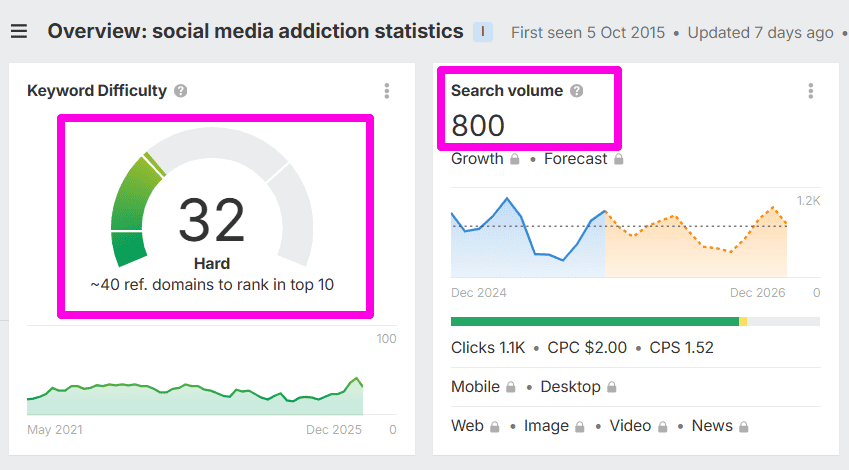
The key is to identify keywords that have good enough search volume and low enough difficulty so you rank on page one.
You don’t need to have thousands of searches per month either…
I’ve found that keywords with just 100+ searches per month are enough to earn backlinks. Think quality over quantity.
There’s one more essential consideration when choosing a topic…
Choose a topic that is relevant to your broader niche and industry. This will make the links you earn more effective for your site.
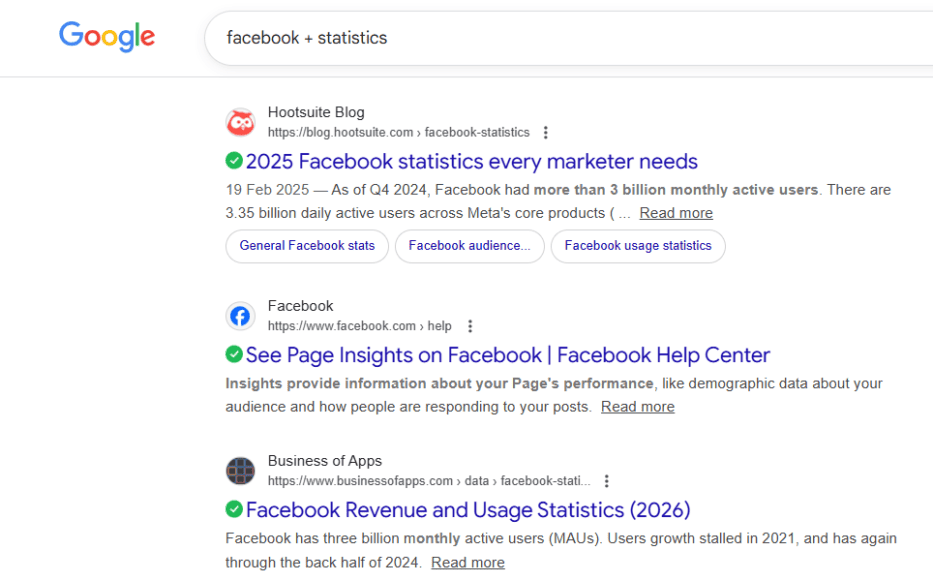
✅ Step #2: Evaluate Your Competition
Next, you want to see what’s already ranking.
Google your target keyword and look at the top 3 ranking results.
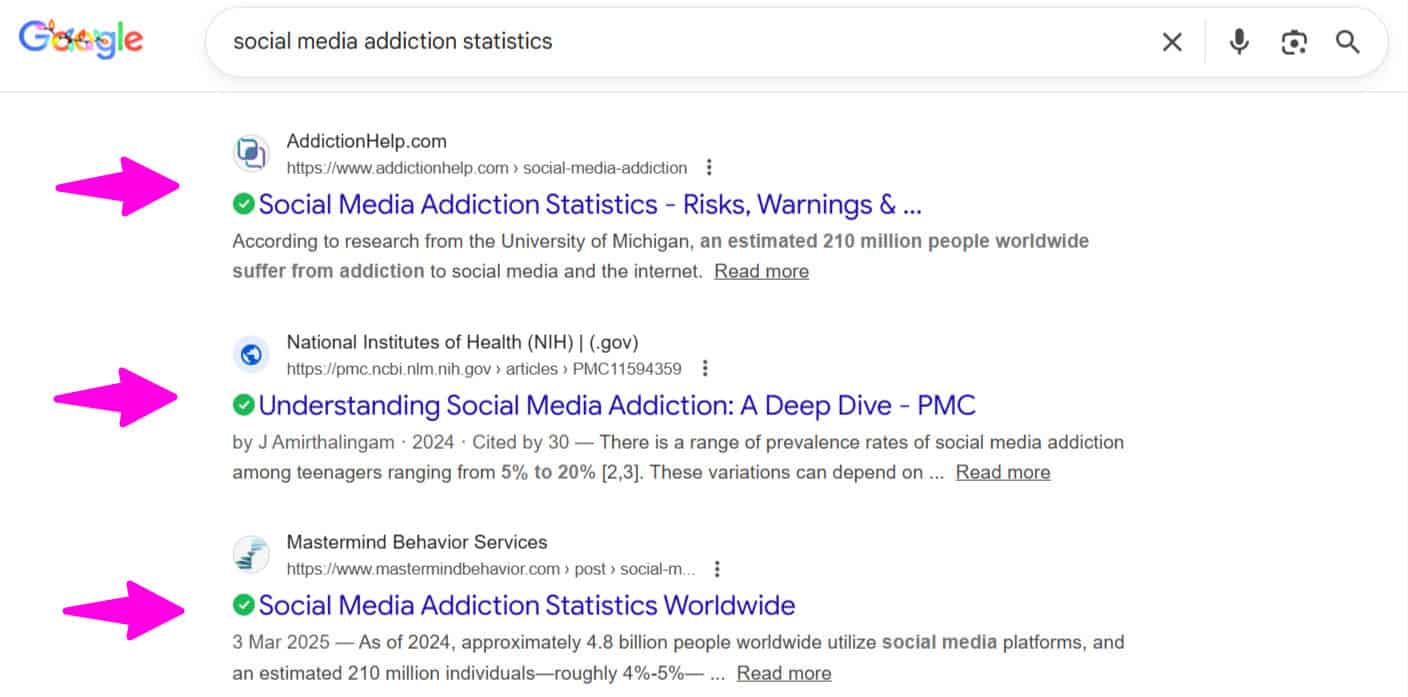
Ask yourself these questions:
- How many statistics do they have?
- How is the content grouped or organised?
- How recent is the data?
- What are they missing or haven’t covered well?
Your goal is to create something 10x better and more valuable.
Evaluating the top-ranking pages will help you understand what’s required to ensure your content reaches the first page comfortably.
Straightforward so far?
Now, I’m going to show you how to calculate how many links you’re likely to earn before you even create the content.
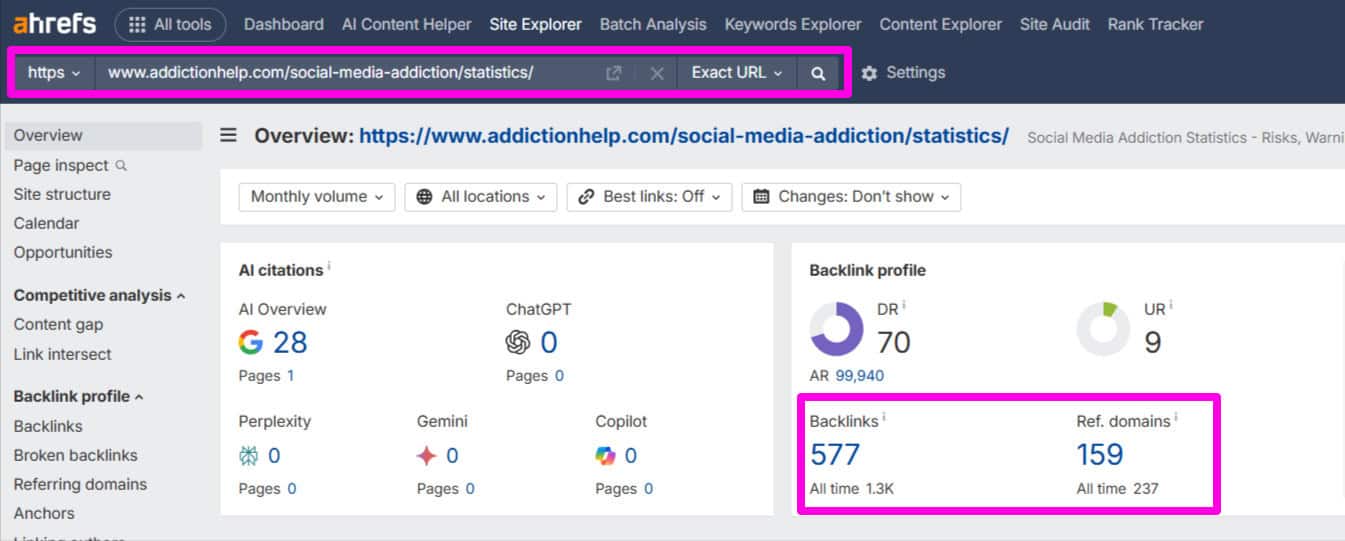
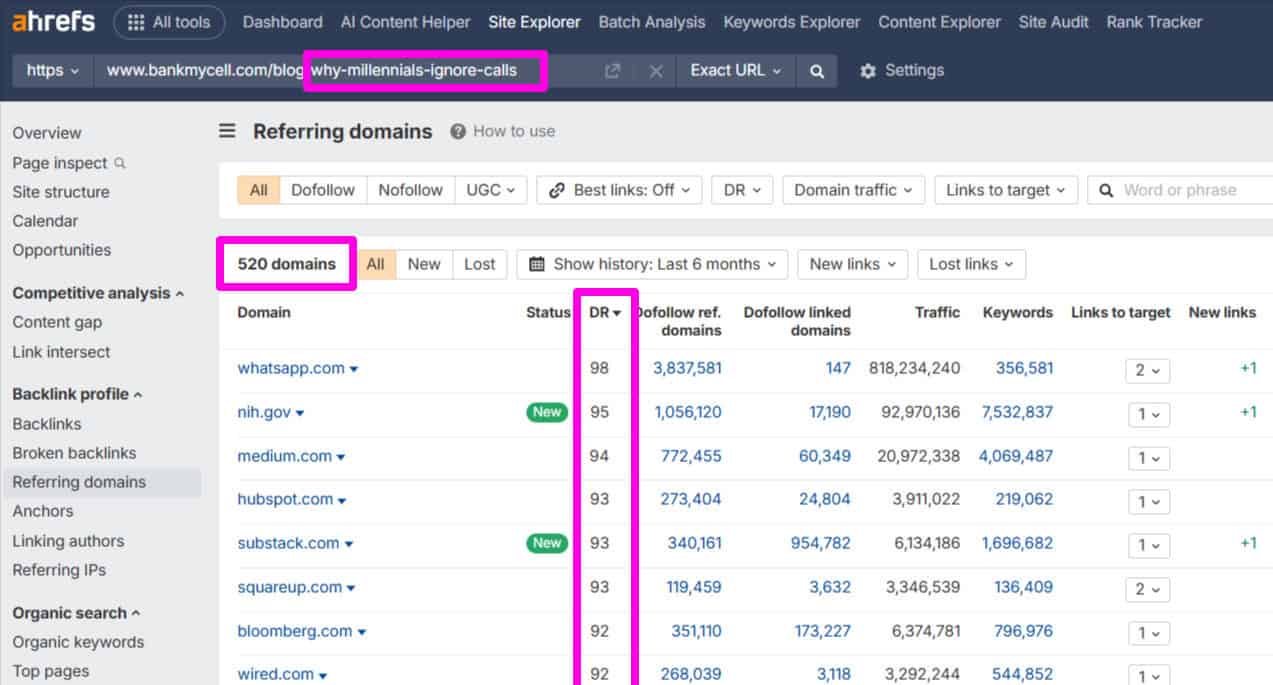
Use Ahrefs to look at all of the backlinks on each of the top three pages. It’s similar process with Semrush if you prefer.
Log in to Ahrefs, paste in your competitor URL and hit “Search”.
Use the following filters at the top of the page:
- Dofollow
- Backlink type: In content
- DR Minimum: 20
- One link per domain
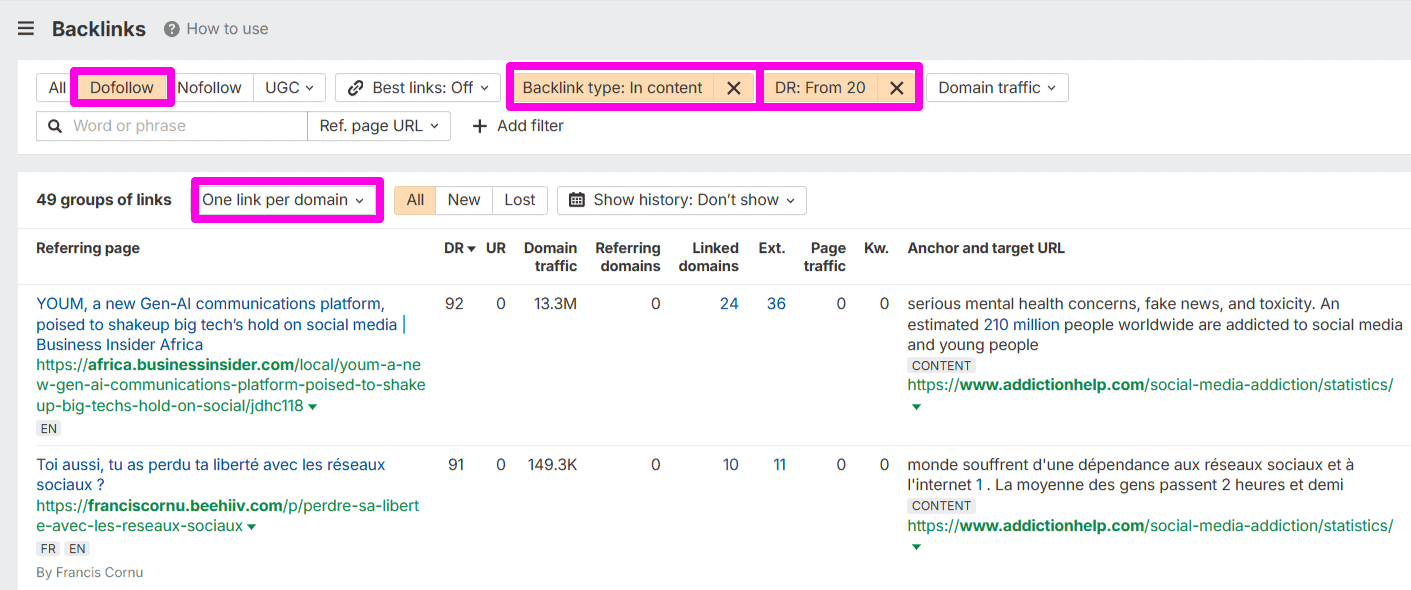
This will get Ahrefs to show you the valuable links that have been earned through the statistics hub content.
Make sure you do this for each of the competitors to get an idea of the types of links they’ve earned and how many.
Pro Tip: Look at the anchor text for each of the links.
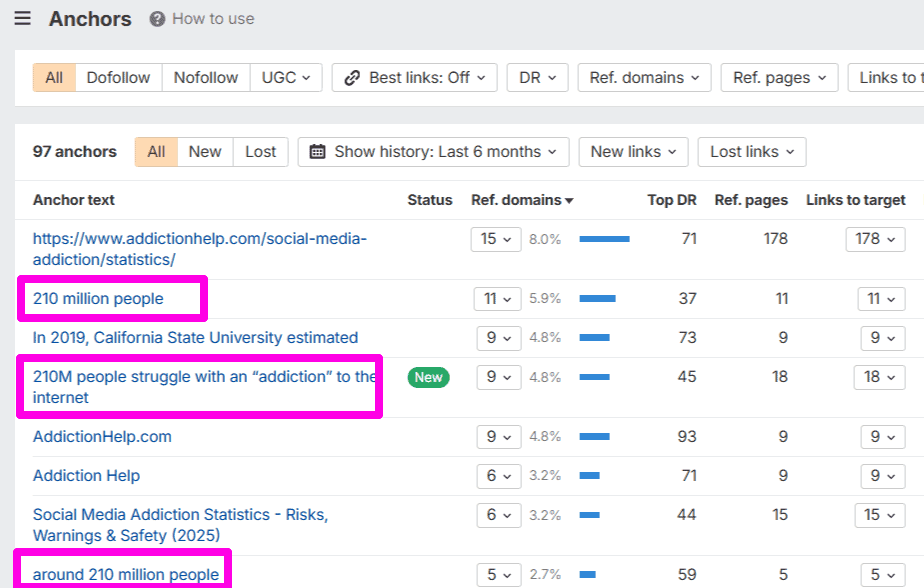
This will give you insights into what stats, data and insights people are consistently referencing when linking to the page.
You must add them to your content as well!
✅ Step #3: Use AI Deep Research To Compile Statistics
Done with your competitor analysis?
Now it’s time to compile all the research, data and statistics for your content.
This used to take me days to find comprehensive data I could use for my statistics hub pages.
But now with AI…it takes minutes.
Let me show you how:
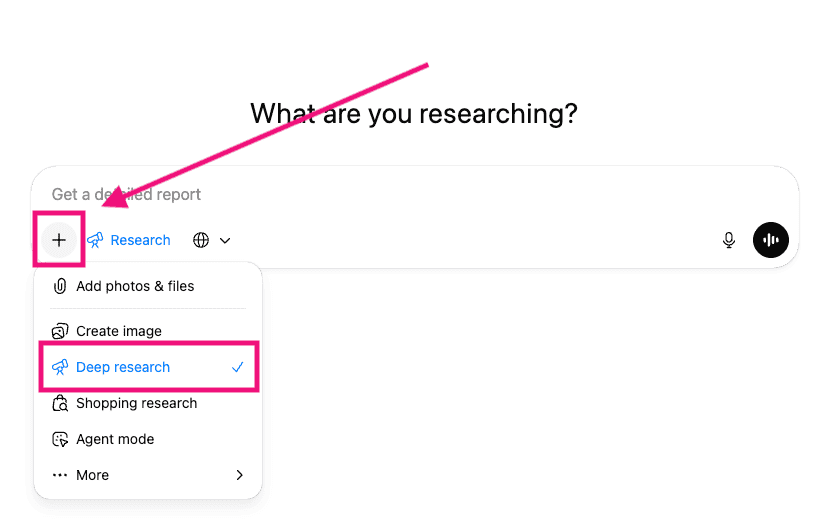
Head over to ChatGPT (or your favourite LLM) and turn on the “Deep Research” feature.
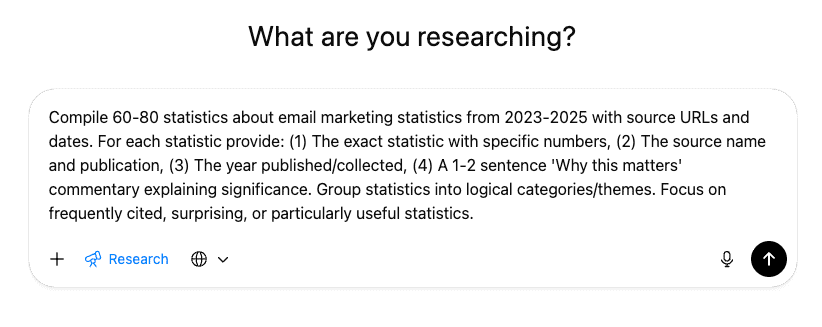
Use this prompt:
“Compile 60-80 statistics about [YOUR TOPIC] from 2023-2025 with source URLs and dates. For each statistic provide: (1) The exact statistic with specific numbers, (2) The source name and publication, (3) The year published/collected, (4) A 1-2 sentence ‘Why this matters’ commentary explaining significance. Group statistics into logical categories/themes. Focus on frequently cited, surprising, or particularly useful statistics.”
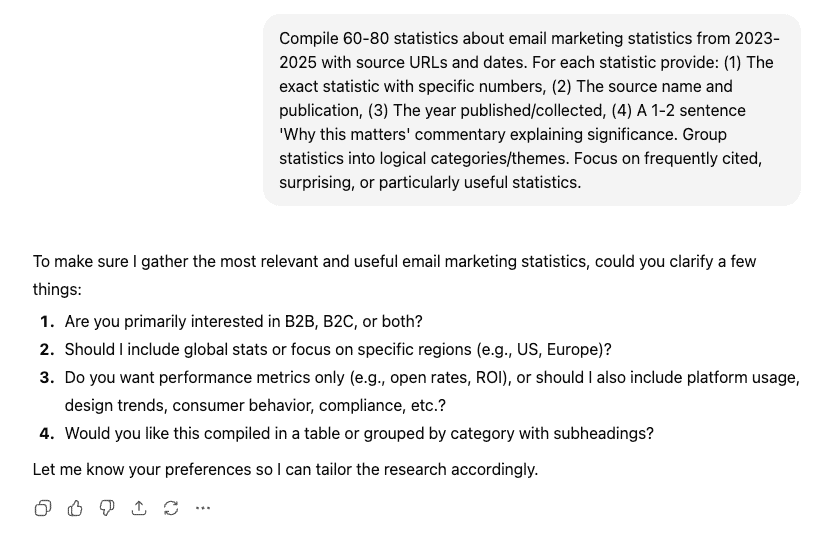
Usually, ChatGPT will come back with a bunch of clarifying questions.
Answer each of them to guide the AI research and ensure you end up with more usable data.
Hit “Enter” and watch the magic happen.
It typically takes ChatGPT about 8-12 minutes to do the comprehensive research.
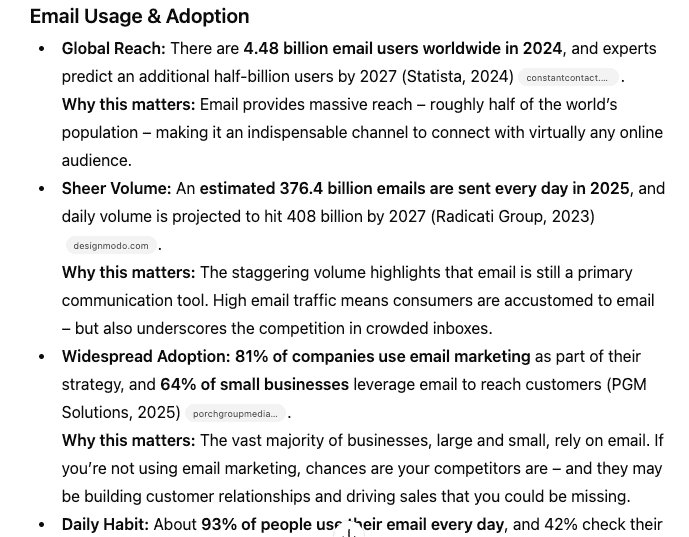
When it’s done, you’ll end up with a list of statistics like this:
But don’t go and start writing immediately.
There is one essential step that you can’t miss first…
✅ Step #4: Verify Data And Add Source Links
Here’s the truth: AI hallucinates.
This is true even when using the deep research feature.
I’ve had instances where AI has completely made up statistics and cited a URL as the source that doesn’t even exist.
So this is important…
You must verify all data and ensure that the source links are correct.
This is how I do it:
Download all of the research as a doc and upload it into Google Drive as a Google Doc.
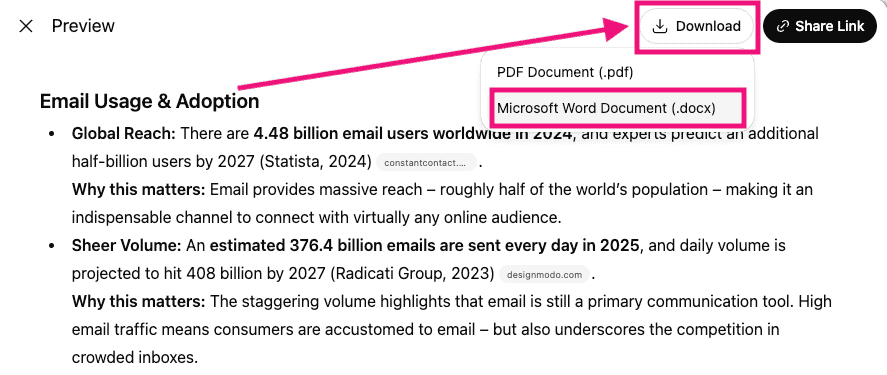
Now, click on each source link provided by ChatGPT and verify the statistic.
I cannot stress enough how important this step is.
It doesn’t take as long as you think because in most cases the statistic will be accurate. But you must add this quality control step.
Once it’s all verified, it’s time to produce the content.
✅ Step #5: Write Your Statistics Hub Content
Journalists, writers and bloggers want to find stats fast.
Google and LLMs also find it easier to understand and index content that is structured well.
For the most part, your research in ChatGPT will have grouped your content into relevant sections.
It’s your job to change those groups into an outline and write the content.
Start by looking at the data and creating your outline. Add headers (h2) and sub-headers (h3) to make a structured outline that has a logical flow.
Add all the relevant stats under each header and sub-header. This will make it way easier and faster to write.
Now, write the content.
The best way to do that is to write in a way that highlights the statistic and interprets its meaning for the reader.
Why is this so important?
You’re making it easier for someone to reference.
Not only are you providing the statistic they need, but you’re explaining why it’s important. There are times when journalists copy my statistics and explanation word-for-word.
It’s a powerful way to stand out and ensure you get the link!
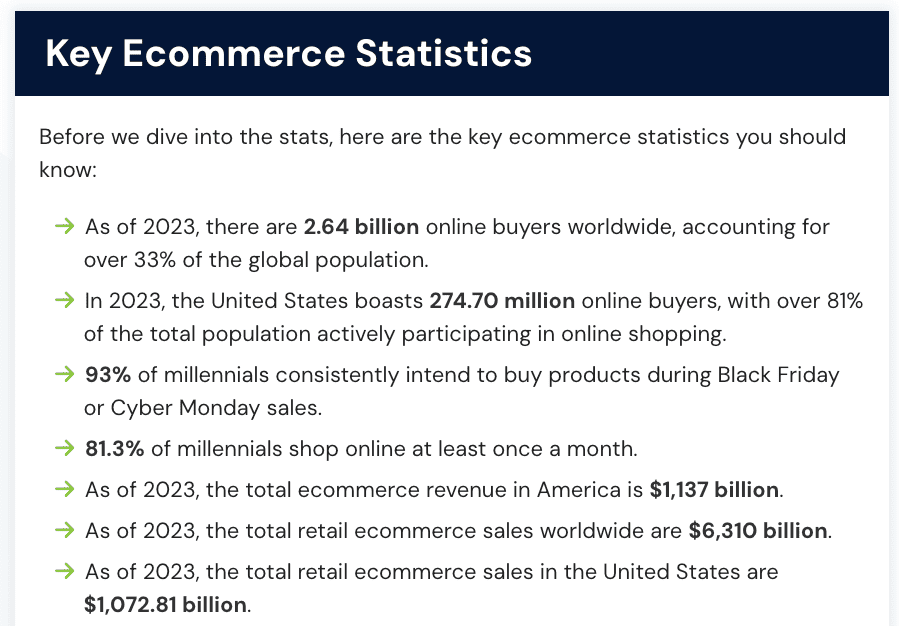
Pro Tip: Add a key statistics section at the top of your content just underneath the introduction. This is good for SEO and highlights the big, important stats to readers.
Don’t rush it…
Spend the time writing great content and don’t use any of the AI content.
This is how you make great statistics hub content that is completely unique and valuable.
Better content = more links.
That’s exactly what you want!
✅ Step #6: Create Graphics And Charts
Adding graphics, charts, tables, callout boxes and bullet points brings your content to life.
This adds authority and trust to your content, as well as helping it stand out. The truth is that journalists prefer linking to sources that look more professional.
Adding extra elements to your page will not only help your content rank better, but also increase the amount of backlinks you’ll earn.
✅ Step #7: Build Initial Contextual Links
No matter how good your content is, if no one sees it…
You won’t earn any backlinks.
You could submit it to Google and hope that it ranks quickly.
But if you’re like me, you prefer to take matters into your own hands rather than relying on the hope strategy.
The best way to do that is to build 3-7 initial links to boost the page’s authority, essentially forcing Google and LLMs to sit up and take notice of it.
You have two options:
- Build the links yourself
- Outsource to a link building service
The best way that I’ve found to build links yourself is to identify pages already linking to other statistics pages.
Reach out to them and let them know about yours.
But you need an angle.
This could be that they have outdated stats on their page, and you are providing them with the latest data.
You could also offer a free graphic they can use on their page, and naturally, they’ll link back to you.
Don’t have time?
Outsource to a trusted link building service like LinksThatRank. This will give you some contextually relevant links through guest posts and niche inserts
Building a few links immediately after publishing is a great way to get some initial traction, and then the passive backlinks will start flowing automatically.
Asset #2: Original Research
Statistics hubs compile existing data, and original research creates new data.
Major news outlets and media publications prefer to cite the original data source. That’s why you are more likely to earn the highest-authority links with original research like this:
How do you get original research?
Short answer: Surveys.
And you don’t need a massive amount of responses either. 300 to 500+ responses are more than enough to get statistically relevant data.
That means even a small email list or social media following works.
This is called a “mini-study” and it great for creating an original research linkable asset.
Here’s my process:
✅ Step #1: Find A Newsworthy Angle
The big secret to creating original research that earns links passively is to find a topic that journalists want to cover.
It’s not actually about the data. It’s more about the topic, story and angle that will get people excited to cover your research.
The data is there to prove what you’re saying is true.
Here are a few questions to ask yourself:
- What assumption in your industry could you test?
- What questions could you answer with data?
- What trend could you quantify?
- What’s a question people are always asking?
Answering these questions will help you find a great topic and angle to do your research on.
If you get stuck, you can always ask ChatGPT.
But the best ideas I’ve had for mini-studies usually come from my own audience insights.
As I like to say, no one knows your audience better than you do.
✅ Step #2: Design Your Survey
AI is very good at designing surveys.
All it takes is a bit of fine-tuning at the end, and you’re good to go.
Head over to ChatGPT and use this prompt:
“I want to create a mini-study about [ADD YOUR TOPIC] that generates 5-10 citable findings for journalists. Provide: (1) Methodology (2) Specific survey questions or data points to collect, (3) Analysis plan for meaningful findings, (4) Key findings framework with headline-ready statements journalists would cite, (5) Visualisation suggestions for shareability. Make it achievable within a short timeframe.”
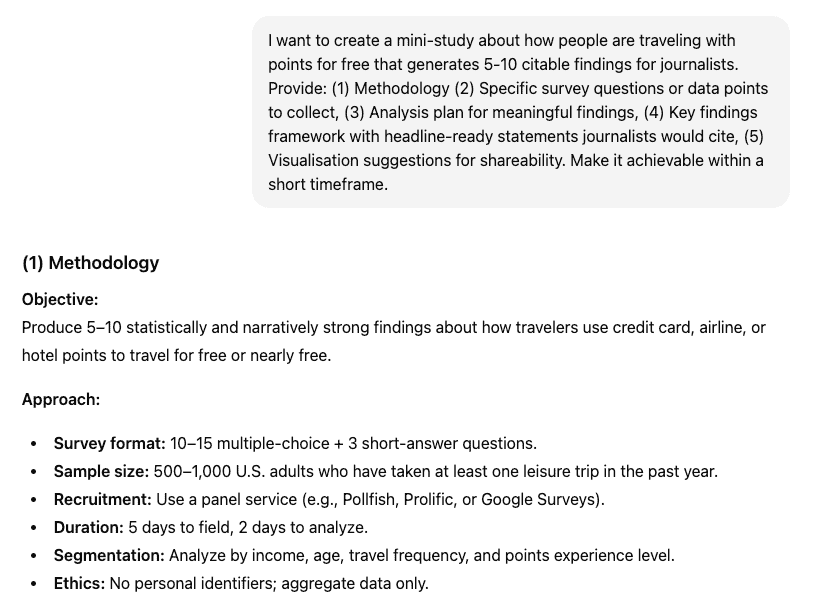
Within seconds, you have completely mapped out the survey strategy and design.
And this is what you can expect in terms of questions:
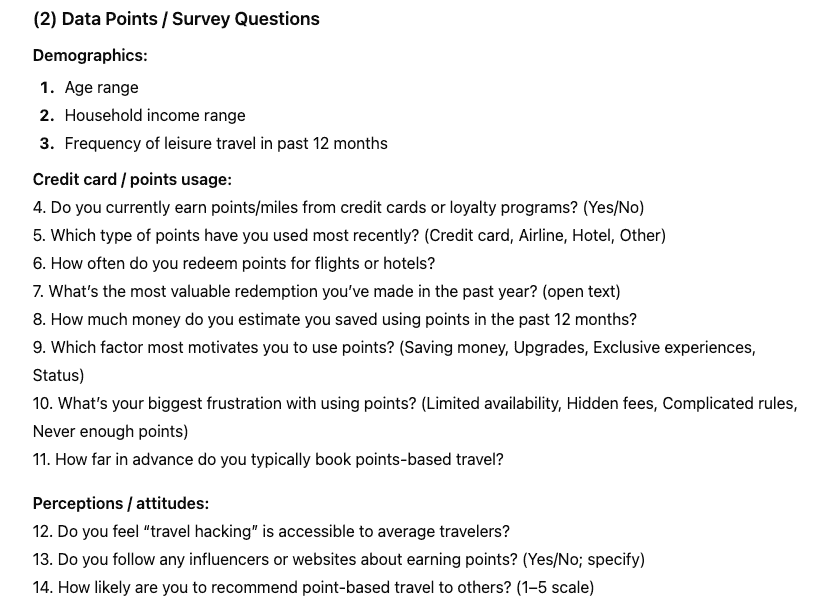
Easy, right?
Now, trim and fine-tune the questions.
You’ll find that not all questions are relevant or needed.
Remember, you want to make it as easy as possible for your audience to fill out the survey so remove any questions that are unnecessary.
✅ Step #3: Collect Your Data
Once you’ve mapped out your survey, the next step is to build it.
Choose a survey form builder like Google Forms, Survey Monkey or Typeform.
They all have a free plan or tier that will give you all the features to move forward.
It’s essential that the data is anonymised.
That means don’t collect any personal information that would identify an individual except for maybe an email address.
Created the survey to collect data?
Now, you’ve got to get respondents.
There are a couple of options here:
- Your own audience (social media, email, web visitors)
- Survey service (Pollfish, SurveyMonkey, Qualtrics)
The best way is to survey your own audience because you control the data and don’t need to rely on any other platform.
But if you don’t have a big enough audience, then you can use a research service like Pollfish.
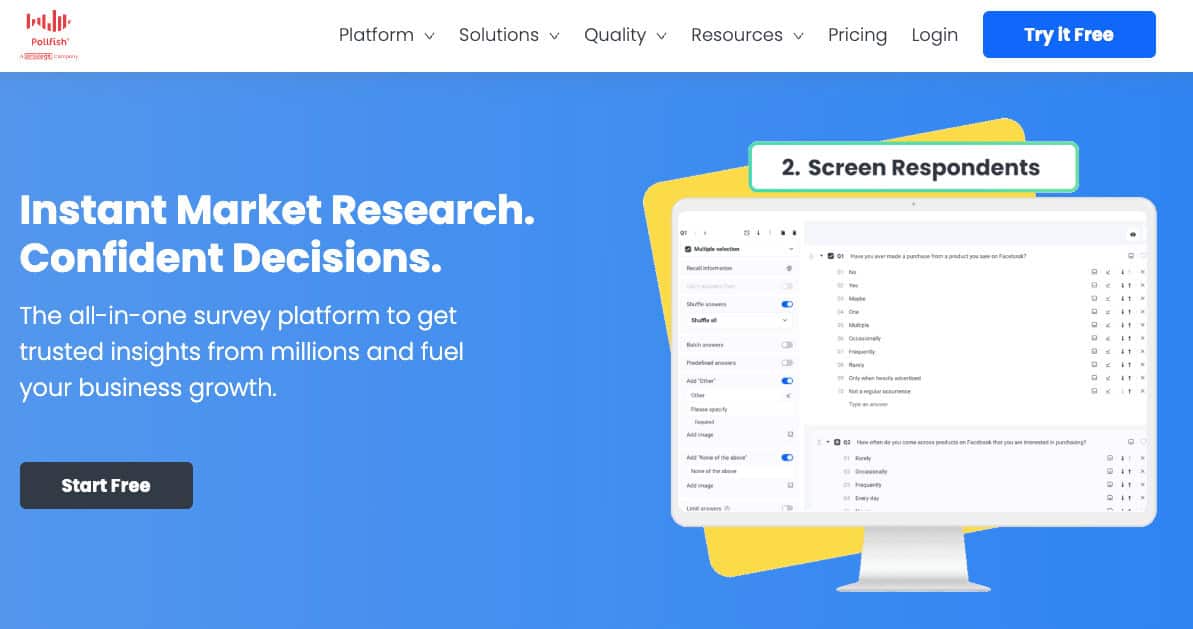
With a research service, you can expect to pay about $0.80 to $1.00 per response.
Aim for around 300-500+ responses so that the data is statistically relevant and provides credible insights.
Pro Tip: Add an incentive like a free gift to your audience for completing the survey.
Think something like an exclusive digital product, checklist or tool you would usually charge for. You’ll get way more responses, which means more data to analyse.
✅ Step #4: Extract Your Findings
Speed up your survey findings using ChatGPT.
Here’s the prompt:
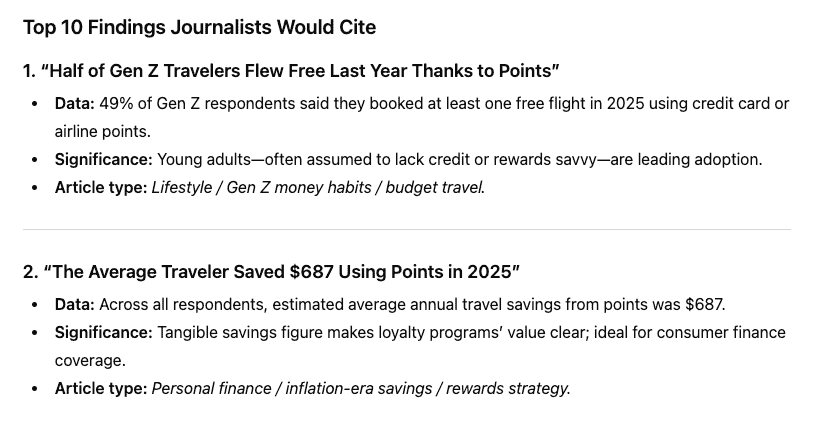
“Here is my study data about [TOPIC]: [PASTE DATA SUMMARY]. Identify the 8-10 most interesting, surprising, or newsworthy findings. For each: (1) Write a headline-ready statement for news articles, (2) Provide the specific supporting data point, (3) Explain why this finding is significant, (4) Suggest what type of article might cite it. Focus on findings that would make journalists say ‘I want to write about this.'”
Double-check the key points that AI extracted to ensure they’re accurate and haven’t been made up through hallucination.
AI results analysis saves you a lot of time and often provides unique insights you might have otherwise missed.
And they’re all geared to what journalists really want to cover – which is important for the last two steps.
✅ Step #5: Structure Your Results Page
Your results page is going to make or break your campaign.
Here’s how to structure the page:
Main Headline
This should be your main finding in headline format.
It should grab the reader’s attention and hook them into your survey results.
Think about the most controversial, surprising, or newsworthy stat from your entire study.
Here’s an example:
- Bad: Small Businesses Are Using TikTok Ads For Marketing
- Good: 67% of Small Businesses Spend More on TikTok Ads Than Google Ads in 2025
Which one would you click?
Make your headline punchy, specific and impossible to ignore. This single line could be the difference between 40 new links and 0.
Executive Summary
Start with an executive summary that highlights your top 5-7 findings in bullet point form.
This is critical because most journalists and writers don’t have much time.
The easier you make it for them, the more likely you’ll earn the link.
Key Findings Section
Next, add the key findings section.
These are essentially the key findings that ChatGPT extracted from the data and they will make up the bulk of your original research page.
Don’t just throw numbers at the reader.
You need to make it easy to scan and contextualise them.
Format each data point like:
- Headline stat – bold and clear statistic-based headline that gets attention
- Supporting data – 3-4 sentences that break down the finding with relevant data
- Context – Explain what the finding means and why it matters
- Data chart, graph or table – A visual representation of the data that attracts attention
Every finding should follow this format.
Your goal is to make the data as accessible and scannable as possible, while providing enough depth that readers understand the point.
Visual Graphs & Charts
Make your content pop and easier to digest.
Create a graph, chart or even a custom graphic for every finding. This should be added to the bottom of each finding.
Visual content gets shared and sourced more often and makes your data easier to understand at a glance.
Methodology
The last section of your original research content is your methodology.
Think of this as your “raw data”.
It should include-
- Number of respondents
- Survey timeframe
- Data collection methods
- Any screening criteria
- Relevant respondent demographics
Just list this information as bullet points. I also like to add a link to a downloadable PDF that has the raw data for the survey.
This adds credibility to your survey and data.
✅ Step #6: Build Initial Authority
To kickstart the process of ranking your original research, you have two options:
📋 Option #1: Run A Targeted Outreach Campaign To Journalists
- Put together a list of journalists who cover topics relevant to your original research.
- Run a cold email campaign with a simple press release, highlighting the main finding and a couple of ready-made angles they can use.
📋 Option #2: Order Links From A Trusted Link Building Service
- If you want to establish page authority quickly, order 3-7 links from a trusted link building service like LinksThatRank.
- This should give your content the authority it needs to rank and start attracting backlinks organically.
Whichever way you go, those first few links signal to Google and LLMs that your research is worth citing.
Once you have the initial authority, the organic links start rolling in.
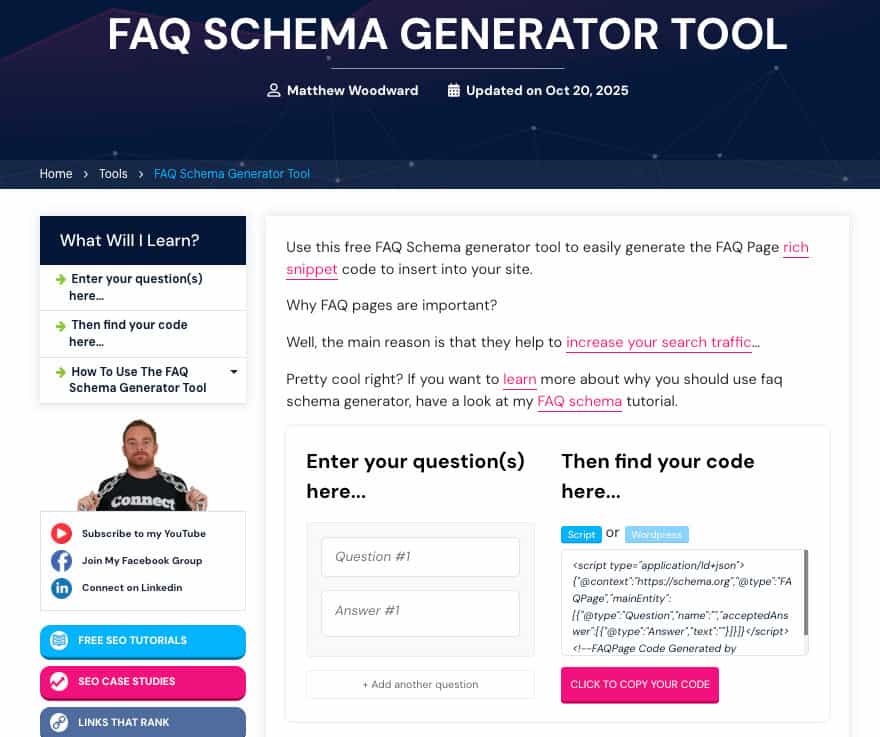
Asset #3: Create A Simple Website Tool Or Calculator
Tools and calculators earn different links than research and statistics.
They get linked in content like:
- Best tools
- Round-ups
- Resource pages
- How-tos
- Blogs posts
Once they rank well, people will naturally share them because they’re useful – especially if they’re free.
It’s a different way to earn links passively, and they provide different types of links.
Why do I love them so much?
Two reasons:
- The links they earn create a diverse, well-rounded backlink profile
- You can generate leads and sales with the tools themselves
You might be thinking… “I can’t code, how will I build a tool?”
Short answer: AI.
It’s easier than you think. But you need to know the right process.
✅ Step #1: Identify A Tool Your Audience Needs
Like all linkable assets, start with keyword research.
You need to know what tools people are actively searching for.
Look for keywords like:
- topic + tool
- topic + calculator
- task + tool
- task + calculator
- how to calculate [metric]
- how to measure [metric]
You’re looking for tools that have enough search volume and you could realistically rank for.
I typically aim for a minimum of 100+ searches per month to make it worth it.
The higher the better, but make sure you pay attention to search competition. You need to realistically be able to rank for the keyword you end up choosing.
✅ Step #2: Design Your AI Tool
Now for the cool part…
With the growth in AI, you can literally now vibe code your own web bases tool or calculator in minutes.
The best AI models for this are:
- ChatGPT
- Claude
- Gemini
My personal favourite for web based tools is Claude using the Opus model. We’ve found it delivers the best and most consistent results.
Especially at the design stage.
You can create a quality mockup in just a few prompts and quickly refine as you need.
Here’s what most people get wrong:
They just focus on the tool component and try to build as quickly as possible.
If you really want success, get AI to think through all of the elements of the calculator and your entire landing page.
Think of it like a comprehensive project scope. You have a road map ahead of you before you even start building.
Use this prompt:
“Design a [calculator/grader/tool] for [PURPOSE] that helps users [GOAL]. Provide: (1) Required inputs with field types and validation rules, (2) Formula/logic step by step, (3) Output format and display, (4) 3 example scenarios with inputs and expected outputs, (5) Landing page structure with H1, H2s, FAQs for SEO, (6) Features that would differentiate from existing alternatives. Make it achievable as an MVP.”
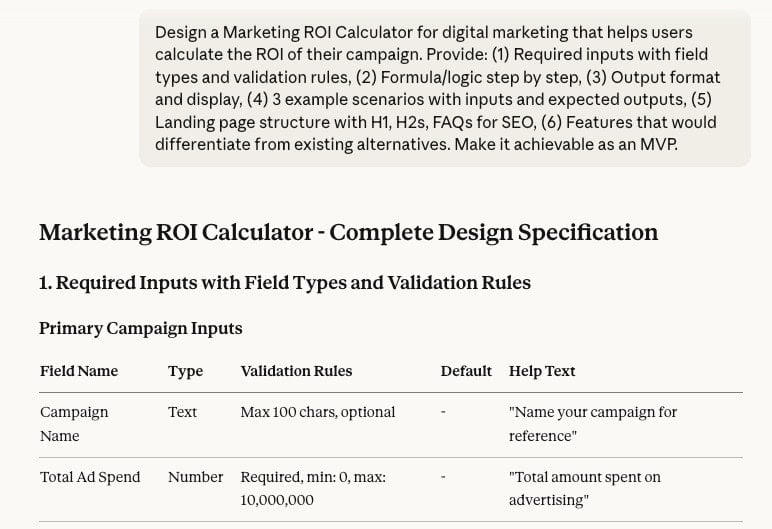
Thist prompt pushes Claude (or any AI model you choose) to map out the calculator before it starts to build.
It helps get all the logic together to ensure it works and looks good on your page.
Now you’re ready to build the tool.
✅ Step #3: Build Your MVP
MVP stands for Minimum Viable Product.
Think of it as only the minimum features and functions needed for the tool to work. This an important concept to keep in mind, especially when vibe coding.
You have four options to build your tool:
- AI-generated vibe coding: Use AI to code your tool in HTML or JavaScript.
- No-code tools like Calculoid and Outgrow: Use dedicated software to build the tool.
- Google Sheets embed tool: Build the logic in Google Sheets, display on website page.
- Hire a developer: Expect to pay between $200 to $500 depending on complexity.
If you’re on a budget and want to build tool for free, Google Sheets or AI vibe coding is the way to go.
If you prefer to use proven software that won’t break, a simple no-code tool like Calculoid and Outgrow is a good option.
I recommend only hiring a developer after you have the tool live and some quality links coming in. This way you don’t waste money or time.
Refine the brief that Claude gave you in in Step #2.
Open a new chat in Claude and paste in your brief, then hit “go”.
This is how my Marketing ROI Calculator turned out:
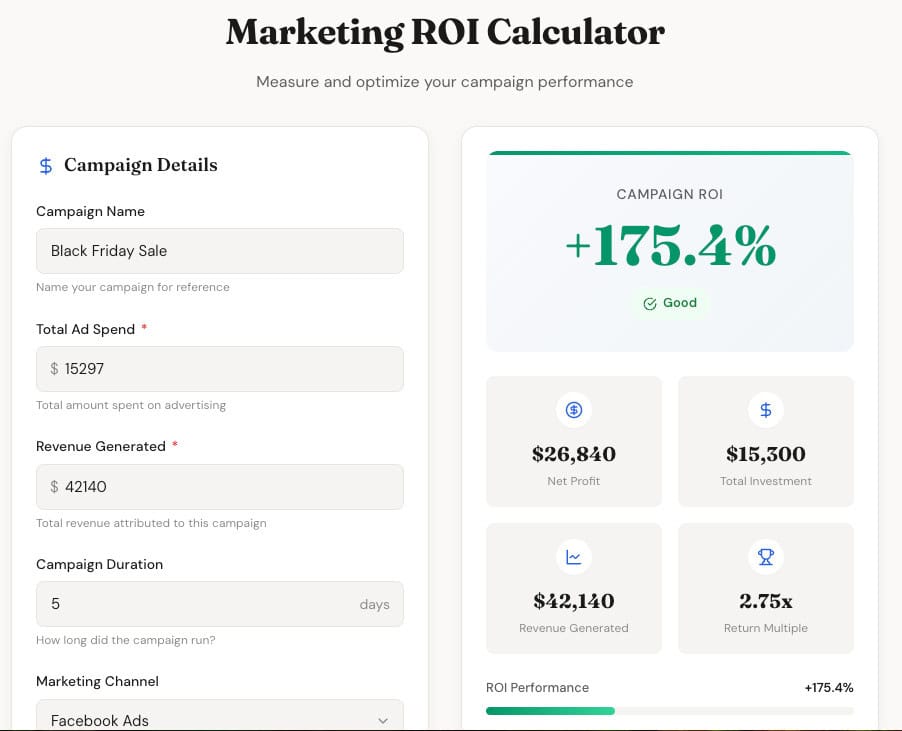
That was 1 prompt using the brief that Claude provided. Not bad, right?
It even provides advanced metrics like this:
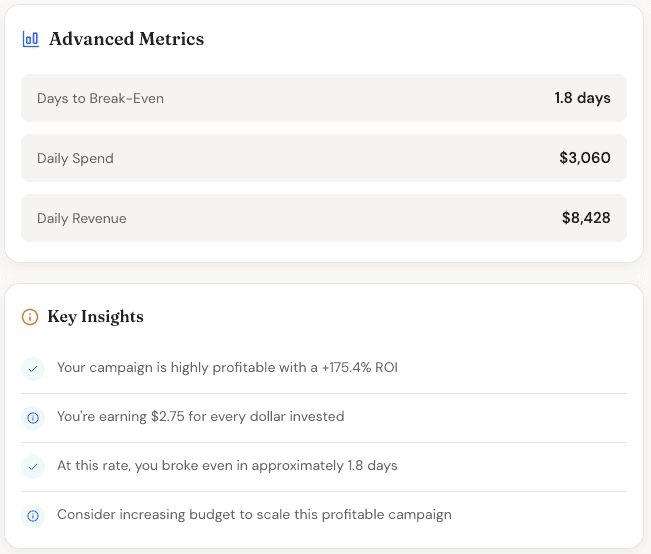
The sky is the limit with what you can create!
Remember:
You only need an MVP. Don’t spend hours refining it yet. Once you have proof of concept that the tools works as a linkable asset, then you can improve it.
✅ Step #4: Create A Strong Landing Page
For your tool to rank…
…you need a strong, optimised landing page.
Here’s the format you should follow:
- Clear headline with your primary target keyword
- 2-3 sentences explaining what your tool does
- The tool front and centre
- Usage instructions
- Examples of use cases for your tool
- FAQ section
- Related content and links
Simple, right?
Your page should have a minimum of 500 words so Google and AI search engines can understand the page.
The main headline, 2-3 sentence explanation and tool must all be above the fold.
You want users to be able use the tool on both mobile and desktop without having to scroll down the page.
Bonus: Create a 2 minute YouTube video explain how to use your tool.
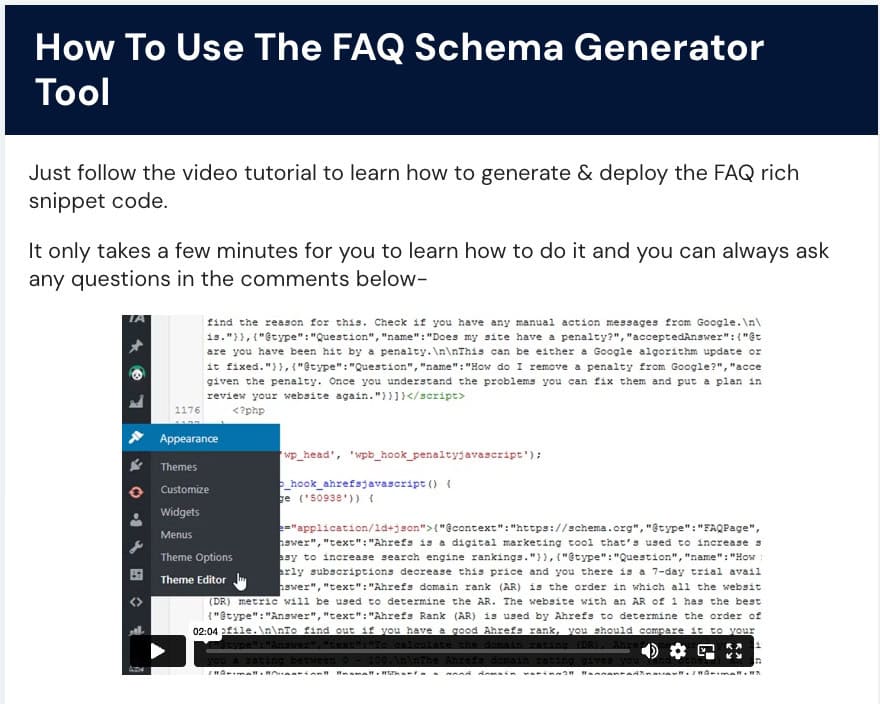
Most people can’t be bothered to do this and it will give you some bonus browny points with Google.
Website owners and bloggers are also more likely to link to a tool that has clear and easy to follow instructions.
Pro Tip: Add schema to your page to make your tool more visible in the search results. This can also help you get cited in LLM answers as well.
✅ Step #5: Build Some Visibility
It usually only takes a handful of links to rank a tool depending on the competition.
I recommend building 3-7 initial links to rank your tool as quickly as possible.
If you can’t build them yourself, get a link building service like LinksThatRank to build them for you.
This will give you some initial visibility and then links should start to flow organically when you hit the first page.

The Complete Playbook Summary
Linkable assets can become the bread and butter of your entire link building strategy.
Here’s a recap of the playbook:
- Build the asset: Choose your linkable asset type based on what makes sense to you and your niche. Identify a target keyword you can rank for, use AI to accelerate the creation of the asset and create something that’s better than the competition.
- Initial Authority: Build 3-7 links for each asset to get some initial page authority and boost rankings. If you can’t build them yourself, outsource to a trusted service like LinksThatRank.
- Rank On Page #1: Monitor your ranking, watch for new links, make SEO adjustments as needed and build more seed links if needed. Competitive keywords may require 10-15+ links initially.
Then just rinse and repeat with as many assets as you can create.
Here’s where the numbers get crazy…
Just 5-10 linkable assets pulling in 5-20 new links passively each month means anywhere between 25 and 200 new natural high-authoity backlinks with zero outreach.
That’s the way to build real authority that pushes all of your site pages rankings up.
Pro Tip: As you start to earn links on your linkable asset pages, add relevant internal links to other pages on your site. This pushes the link equity through your site and boosts the linked pags rankings.

Wrapping It Up
Now you have the framework, processes, AI prompts and capabilities to create three different types of proven linkable assets.
The question is…
Which one will you build first?
- Spend 10 minutes brainstorming ideas that make sense for your website.
- Then, choose your favourite idea and get to work.
- Do just one at a time.
Trying to build too many at once will lead to poor results.
Follow each of the steps above to build linkable assets that deserve to rank.
Remember:
In most cases you will need some initial seed links to get initial rankings.
If you don’t want to build them yourself, I recommend getting LinksThatRank to do it for you. That way you can focus on creating more linkable assets!

Frequently Asked Questions
You Might Also Like


What Are Your Thoughts?
3 Responses

Spelling error – “build as quickly as possibel”
Thanks, Karl – We corrected it!
Very helpful guide You explained linkable assets in a simple and clear way. I liked the focus on ranking on page , AI citations, and using stats, research, and tools to earn natural backlinks. Easy to understand and very practical for beginners and SEO learners.